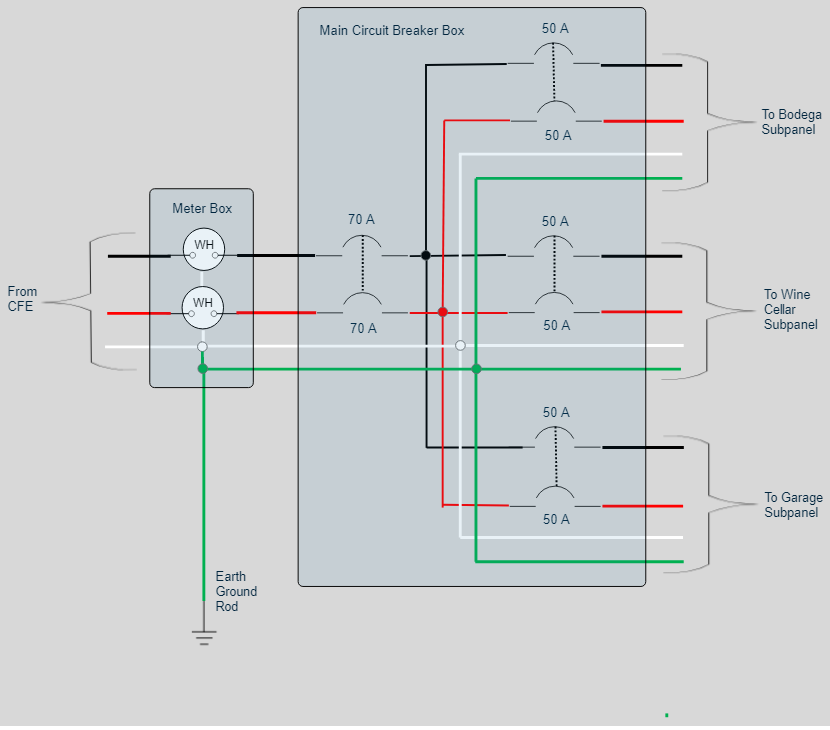
The electrical wiring for our house consists of two 120 VAC meters, one main panel, and three subpanels. The diagrams below show the arrangement.
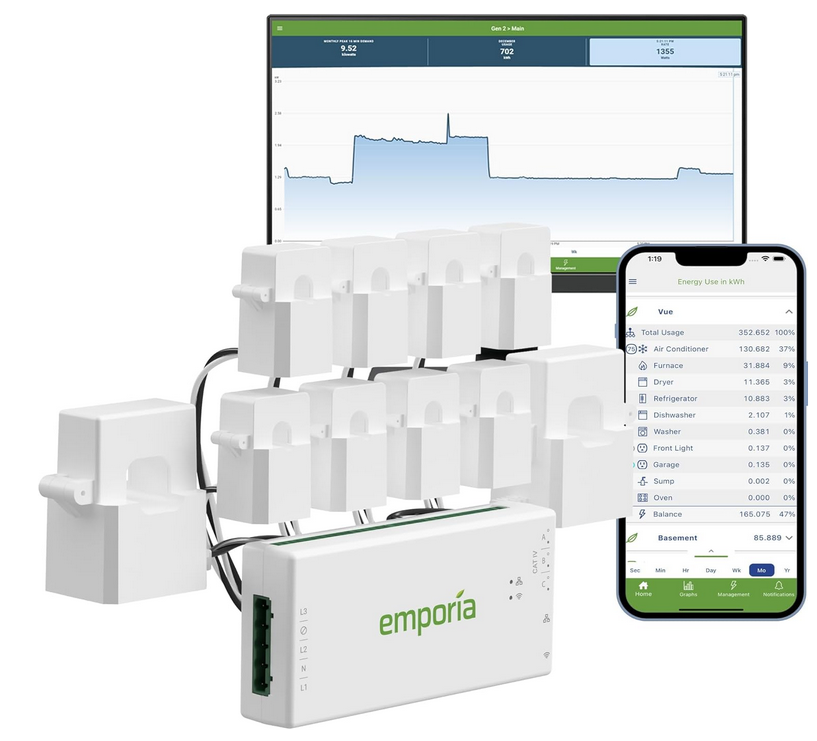
An Emporia energy measurement system was used at each of the subpanels to record the peak power and daily energy used over a one week period. The running (peak) power for each of the loads is tabulated and the average energy usage per day is listed for each branch circuit. All of this data is organized by subpanel, branch circuit and load, and it is discussed in the following sections. Actual measurements (as opposed to calculated totals, etc.) are highlighter in green in these tables.
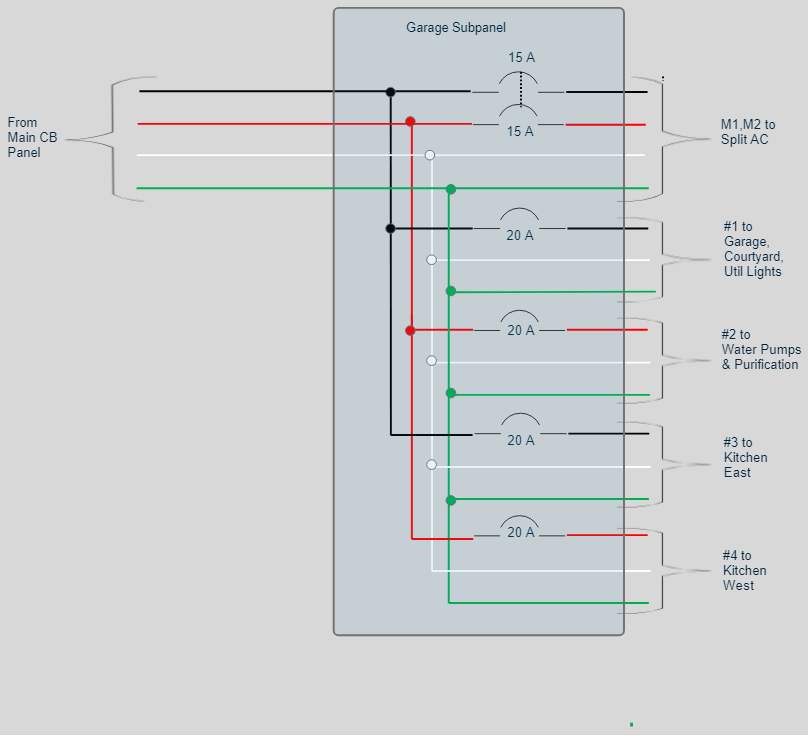
Garage Subpanel Measurements
Instantaneous power was measured using the Emporia energy measurement system by turning on individual loads and noting the change in the power (1 second sampling) that occurred in the circuit to which the device was connected. This works for simple loads like lighting that are constant, but not so well for cyclical loads like refrigerators, dishwashers, etc.
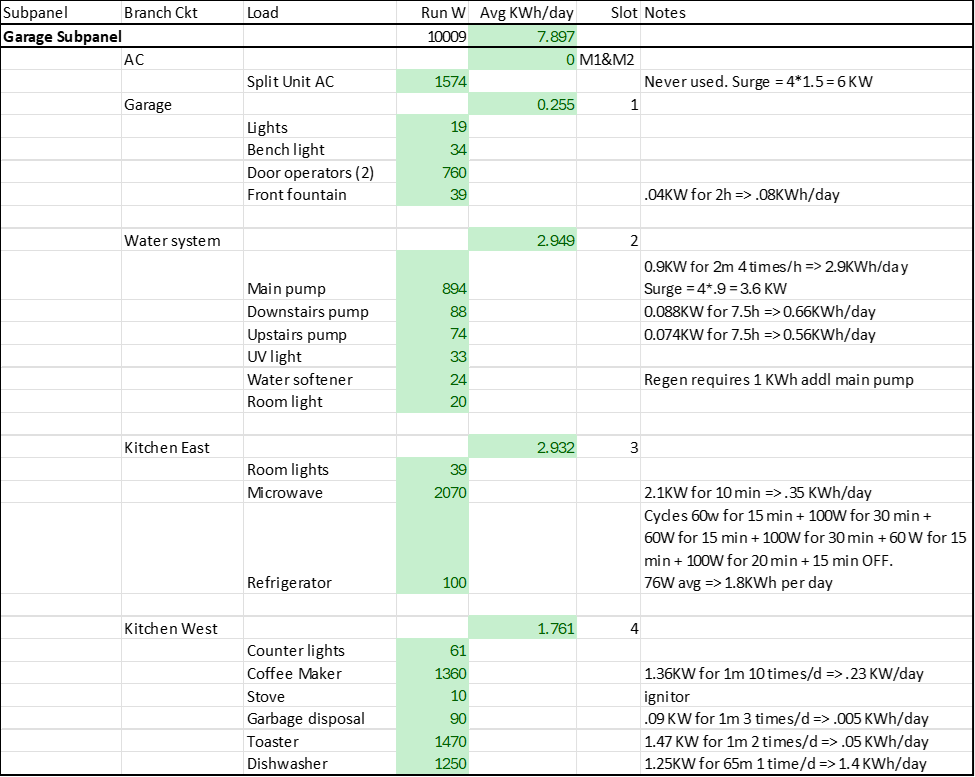
Energy data was collected for all individual circuits and the complete subpanel over a 7 day period from March 30 through April 4, 2024. The resulting data is tabulated below:
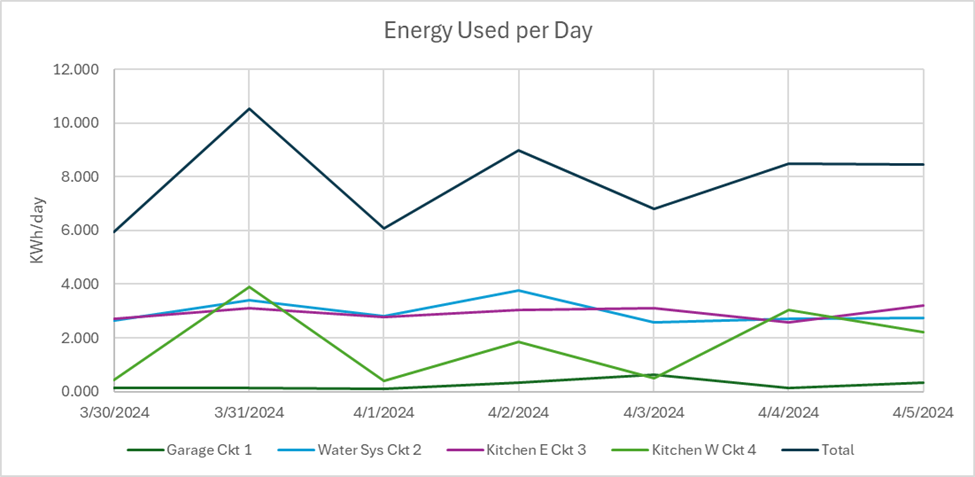
The figure below shows the energy consumed in the individual circuits as well as the total subpanel energy by day. The average total daily energy required is 7.9 kWh but it varies from day to day mainly as a result of the dishwasher.
To see better what loads are consuming this energy and what power they are drawing, the data is plotted on an hourly basis in the following three graphs. Note that while these plots are shown as energy in kWh they are all for one hour periods, so they are equivalent to the power in kW averaged over each one hour period.
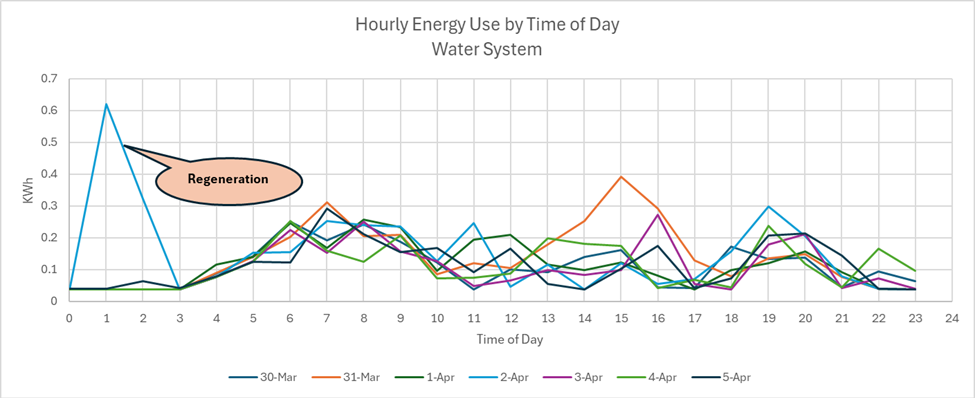
The Water System Circuit #2 is active throughout the day from about 6:00 AM though 10:00 PM. However, there is a large usage of water (actually a large usage of energy to run the main water pump) in the middle of the night on April 2. This corresponded to the regeneration cycle on the soft water system. Average energy consumed by the water system was 0.122 kWh per hour.
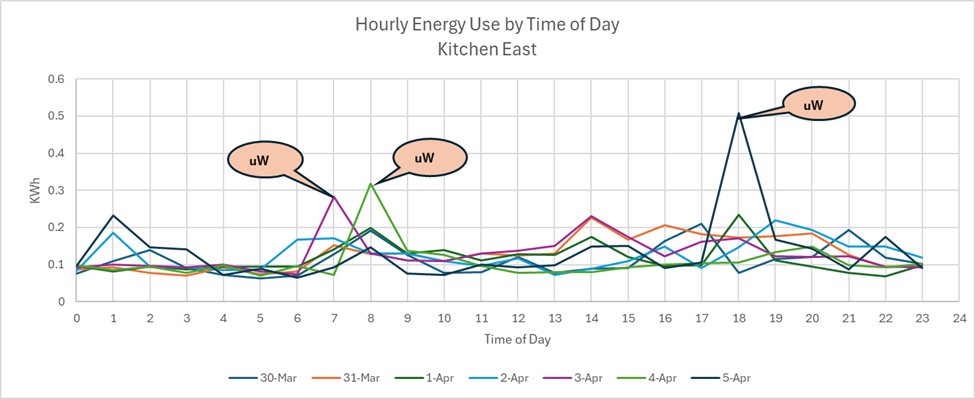
The Kitchen East Circuit #3 contains the large refrigerator and a microwave oven. At the one hour scale shown, the operation of the refrigerator is not obvious, but the microwave is. The average energy consumed by this circuit was also 0.122 kWh per hour.
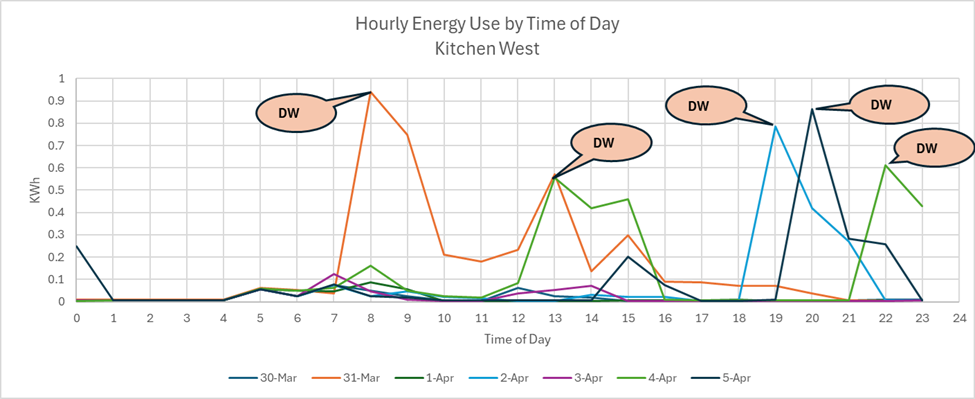
Kitchen West Circuit #4 contains a dishwasher and garbage disposal. The dishwasher stands out in the above plot. It consumes about 1.4 kWh per cycle, but indirectly it consumes another 0.4 kWh because of the demand on the main water pump. This correlation is more obvious in the plots below with time resolution in the minutes. The average energy consumed by this circuit was 0.073 kWh per hour.
The energy meter also provides power consumption in kW on a minute by minute basis. This data is useful in identifying the cycles associated with loads as well as the peak power demands.
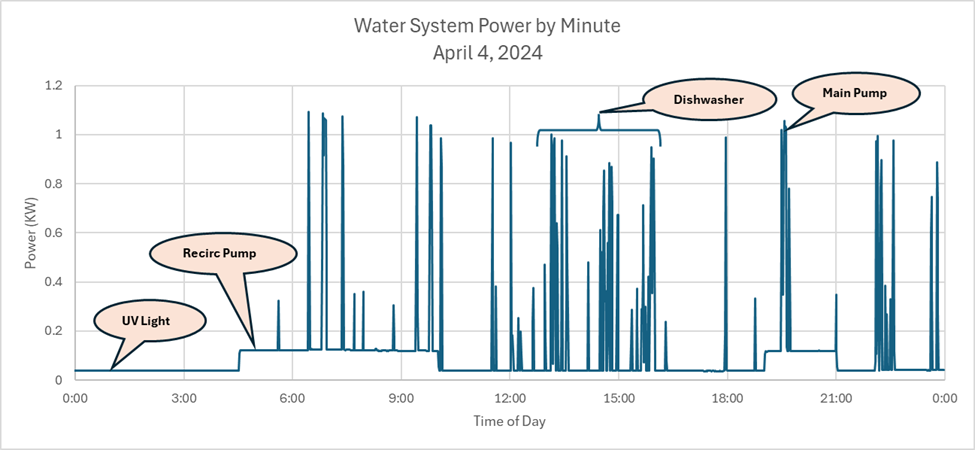
The main water pump draws about 1 kW but in short pulses of about 1 to 2 minutes each. There is a concentration of these pulses in the 1:00 to 4:00 PM hours which is when the dish washer was run. The hot water recirculation pumps are controlled by a timer and the UV light is always on. Peak power for this circuit is 1.15 kW.
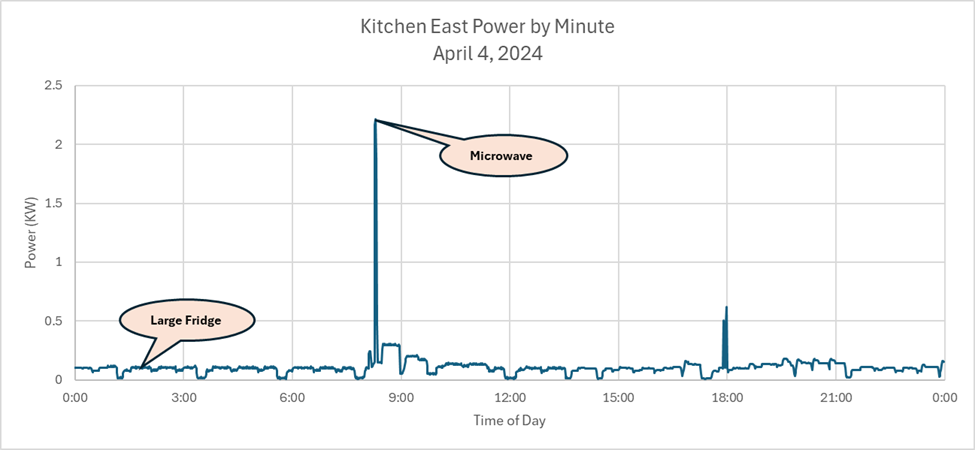
Kitchen East shows a low but continuous cycle that is the large refrigerator. It also shows a single large pulse of power which is the microwave oven. Peak power is dominated by the microwave and is 2.25 kW.
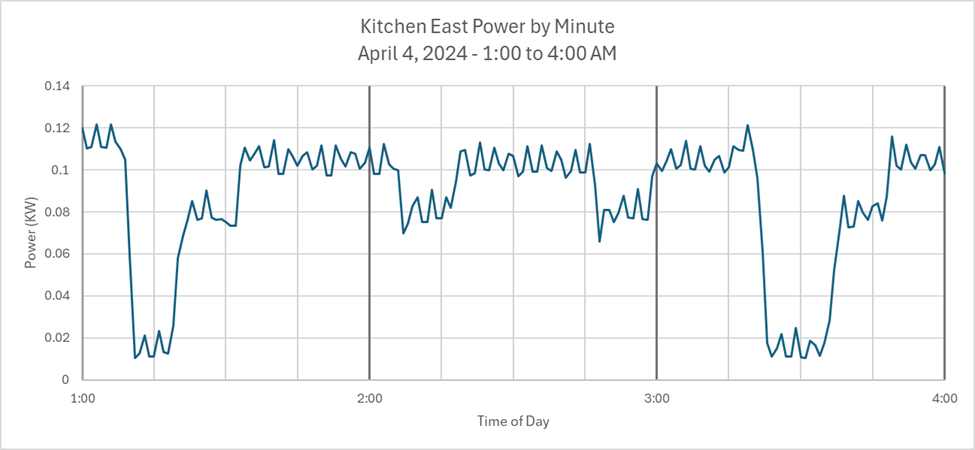
This is the same data, but zoomed in to the night time hours of 1:00 to 4:00 AM to show the large refrigerator power pattern. Subtracting out the 10 W for the microwave and refrigerator panel lights, the cycle starts at 1:20 AM with 15 minutes at 60 W, then increases to 100 W for 30 minutes, 60W for 15 minutes, 100 W for 30 minutes, 60 W for 15 minutes, 100 W for 20 minutes, and 15 minutes OFF. Average power is 76 W, peak power is 100 W and energy used per day is 1.8 kWh.
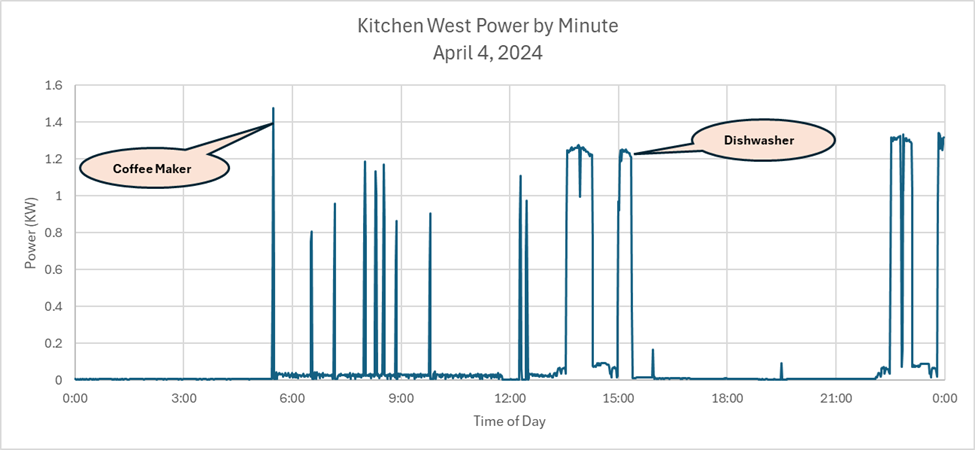
The kitchen west power shows spikes of 1.4 kW for the coffee maker and broader pulses of 1.2 kW for the dishwasher. Peak power is 2.54 kW over the week’s period and occurs when the coffee maker and dishwasher were used together.
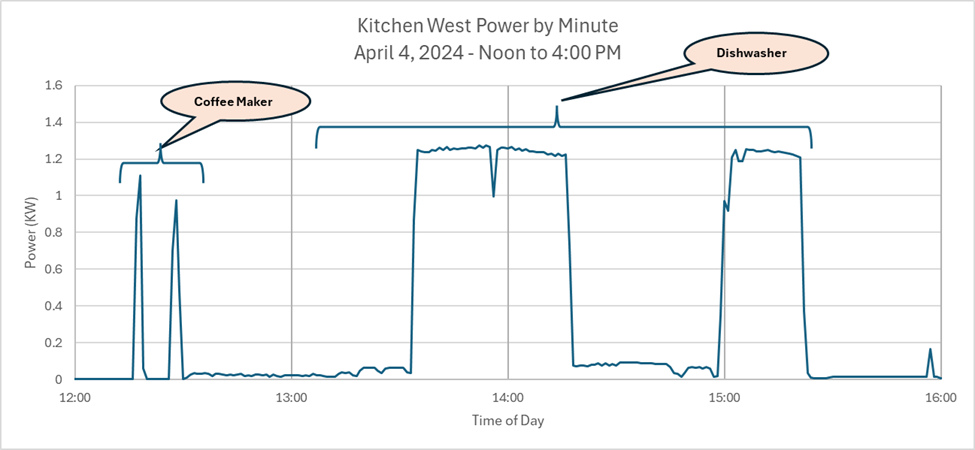
The dishwasher has a peculiar power profile as shown by the zoomed in view above. Power of 1.2 kW is required in two periods – the first is 45 minutes long and the second is 15 minutes long. Before each of these power periods, the dishwasher is receiving water as shown in the following figure.
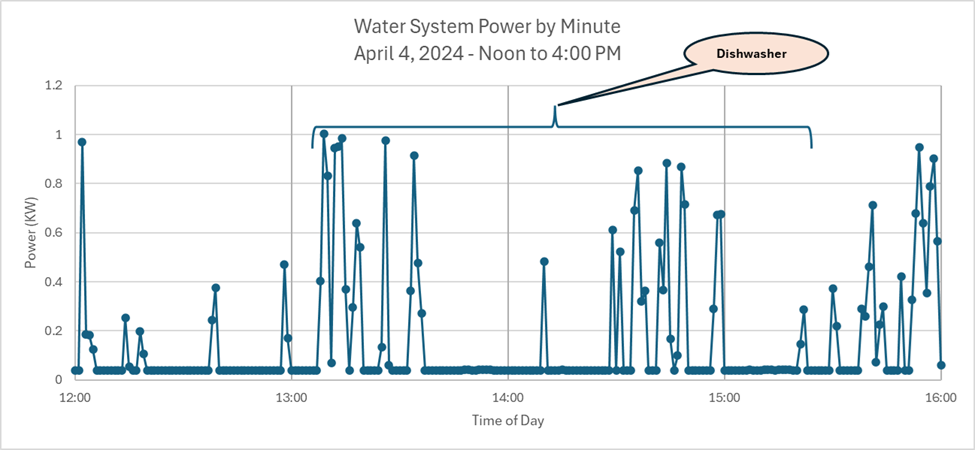
The main pump delivers water to the dishwasher during the two periods when the dishwasher is not running high power. Still, the amount of power required for the main pump during these intervals can be roughly calculated from the above. Each dot represents a one minute sample. So during these periods, the main pump is running about 27 minutes (in 1 to 2 minute pulses). This works out to .40 kWh per daily cycle.
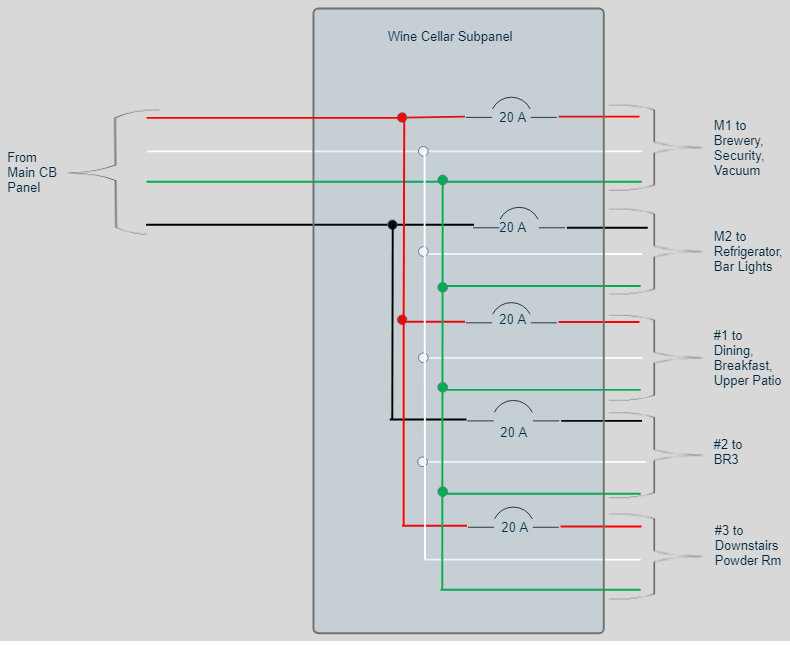
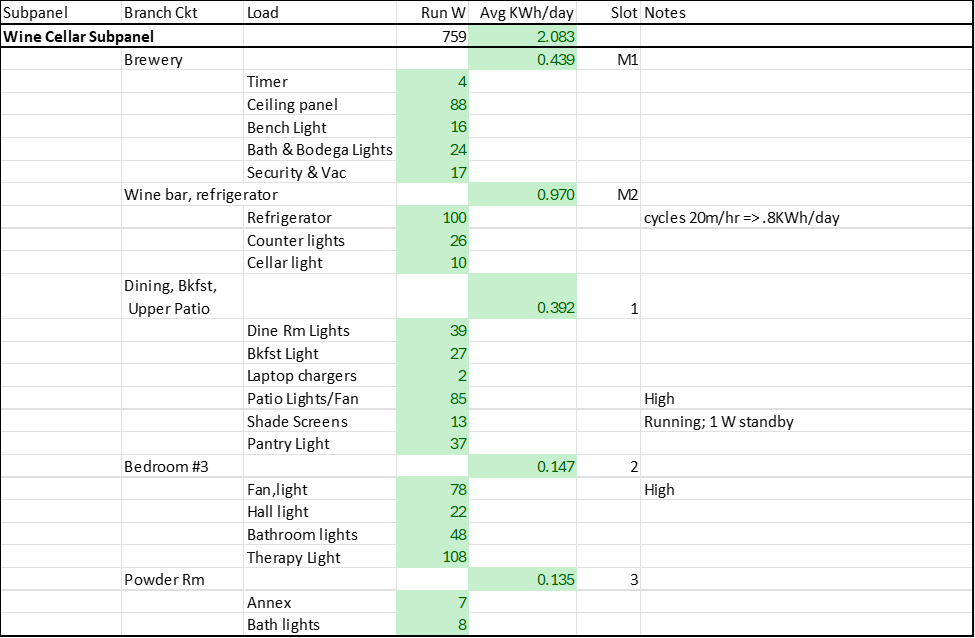
Wine Cellar Subpanel Measurements
Running power and average energy used per day is listed below for the wine cellar circuits.
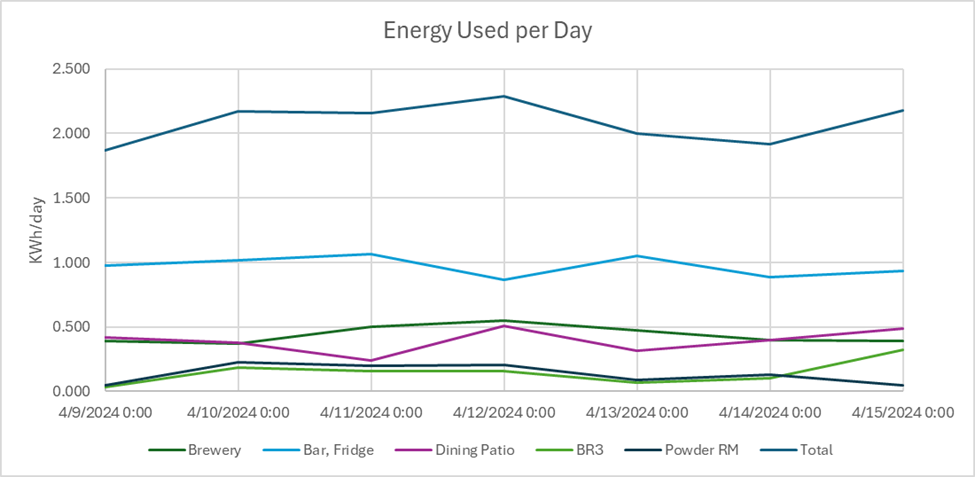
Total daily energy used by the wine cellar circuits is shown below over a one week period. Most of these circuits are minor lighting loads.
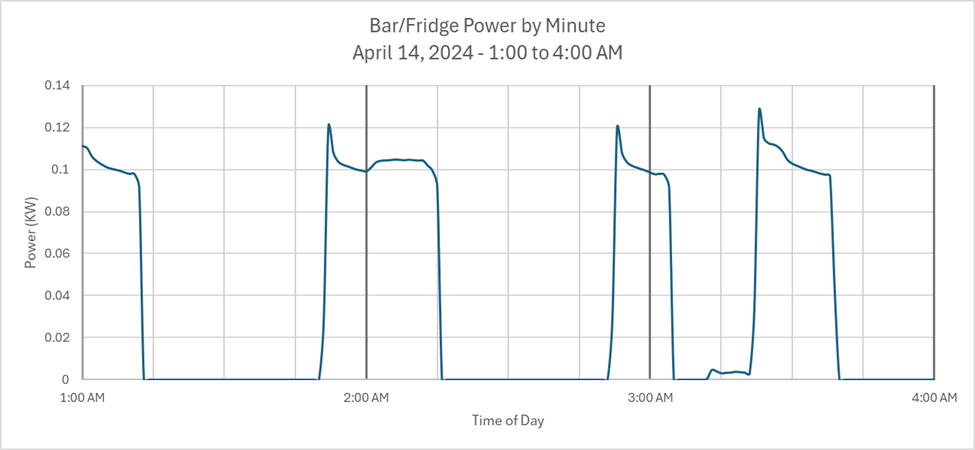
The Bar Fridge circuit is of interest because it has an odd cycling pattern. This is shown below. The refrigerator draws approximately 105 watts when the compressor runs for about 20 minutes each hour. But the pattern is irregular.
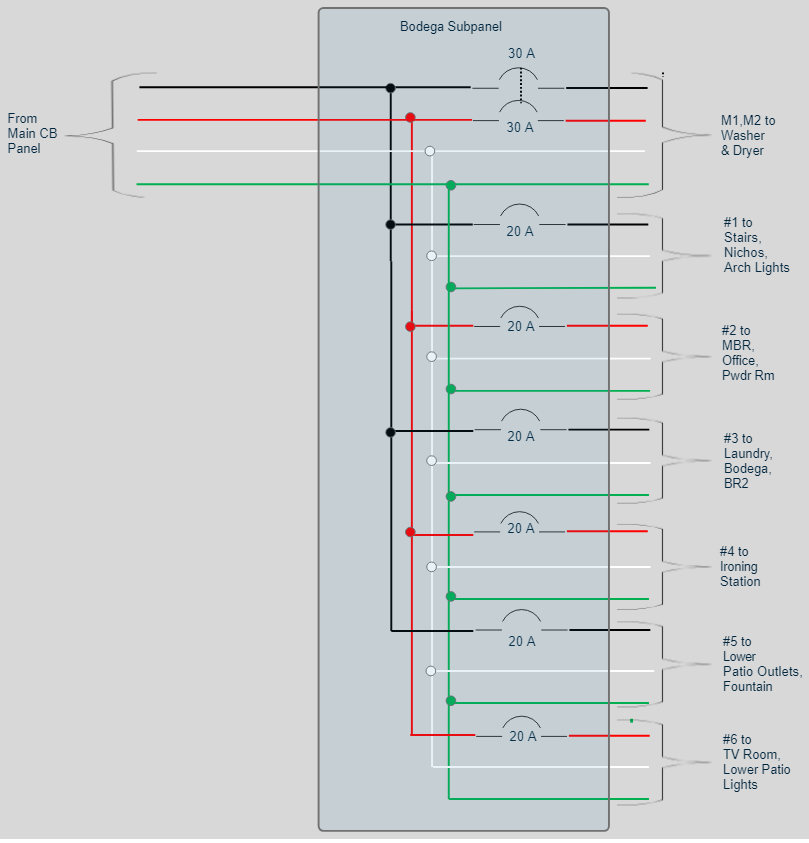
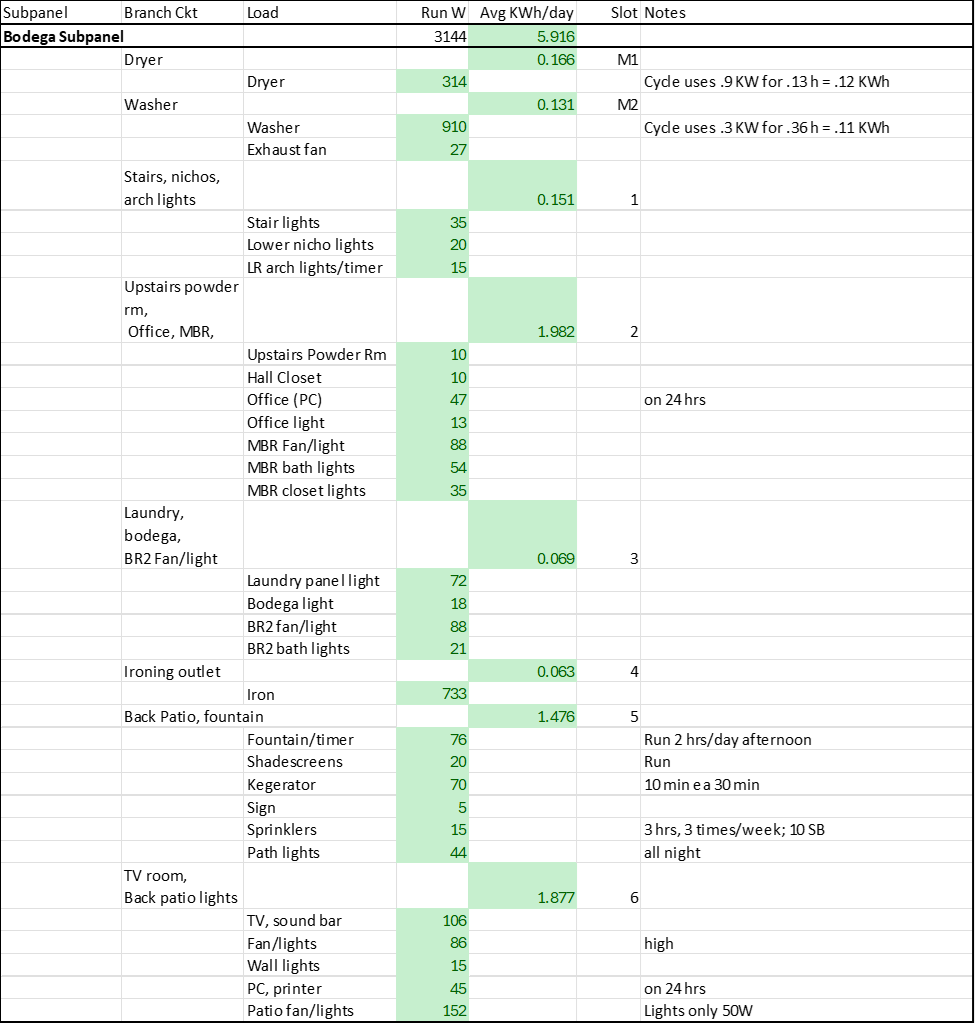
Bodega Subpanel Measurements
The tabulated power and energy data is listed below.
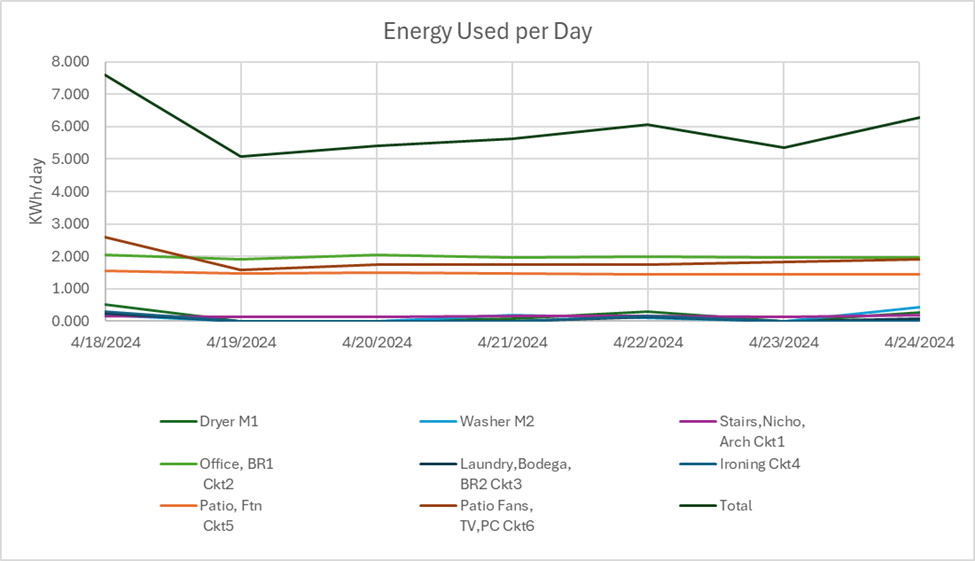
There are eight circuits in this subpanel. Over a week’s period, the energy used per day is as shown below. Most of the energy is used for lights, ceiling fans, etc.
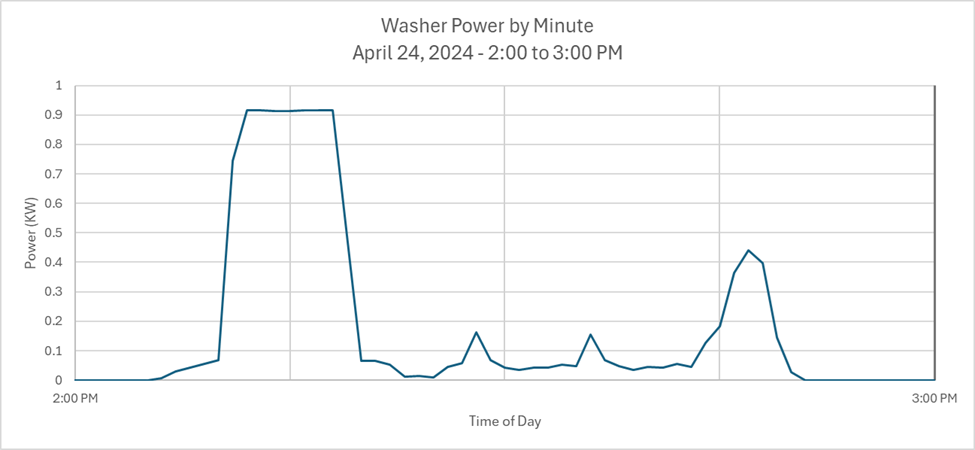
The washing machine has the power profile shown below. One cycle of the washer used about 0.9 kW x .13 h = .12 kWh.
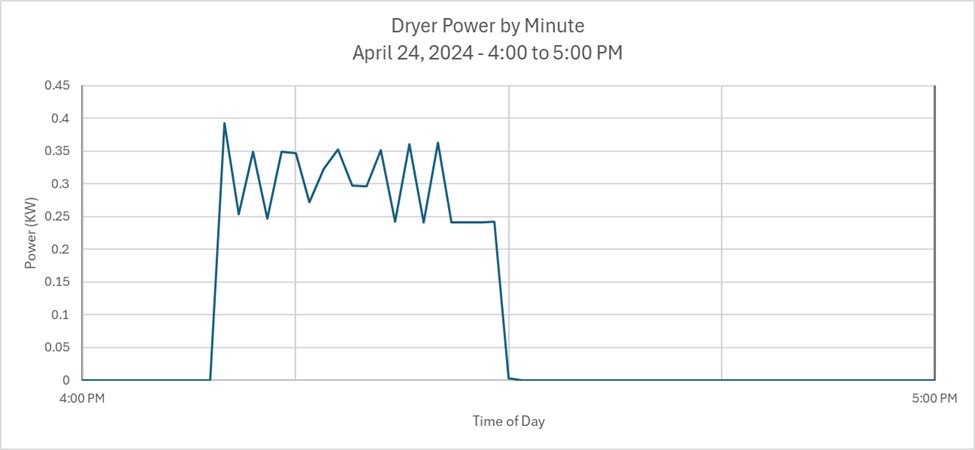
The gas dryer has the following power profile. The dryer consumes about .3 kW x .36 h = .11 kWh in one cycle.
Whole House Totals
Overall totals are summarized here.

Note that the average kWh used per month is 477. This compares well with the typical CFE billing of 450 to 500 kWh per month.
It is not really necessary to record and plot all the data as shown above. Much of this was done out of personal curiosity. But the data listed in the tables is important, not only for determining which circuits are critical for survival and what their power and energy requirements are, but also as a way to identify ways to save energy under normal conditions. For example, I found two 100+ watt halogen MR-16 bulbs that were hidden in recessed columns and used for night lights. These were replaced with identical looking LED bulbs that produced the same light with only 4 watts of power.